PivotTable and PivotChart with Microsoft Excel

In this post I use a sample spreadsheet that stores the grades of a college student to show how to create a pivot table and a pivot chart using Microsoft Excel 2007.

Note: Although I use Microsoft Excel 2007 to illustrate the creation process, I provide at the end of this post a spreadsheet compatible with Microsoft Excel 2003.

Pivot Table
A pivot table is extremely helpful when we want to summarize data through different forms. It gives us the possibility of arranging what data we want summarized and in what shape we want them.

The following is the sample spreadsheet I'm going to use throughout this post:

The above spreadsheet has just one sheet named Grades.

To create a pivot table go to the Insert tab on Microsoft Excel 2007 and select PivotTable.

You'll be asked about the range. In the case of this sample spreadsheet just type B2:I72.

You then can choose where to place the PivotTable. I selected New Worksheet.

After doing this, you'll have the following screen:

Note that the column headers of the sheet named Grades are included in the PivotTable Field List on the right of the screen.

Just for the sake of organization, let's rename this new sheet PivotTable.

OK. Now we can start summarizing the data as we want. To accomplish this we must choose what fields/columns to add to the report.

What I want to do in this sample case is a simple task: to average the student grades by terms.

I start by selecting the field Term and then I drag and drop it on the the Row Labels area:

It's clear that what I'm doing is to represent each term by a row in my report.

Now I'll repeat the drag and drop action but this time with the Average field. I'll put this field on the ∑ Values area.

After doing this last action, we get something like this:

At this point we start getting some results; but wait, we're getting the sum of the student's grades for each term. That is not what we want to do. To correct this we must left click the Average field on the ∑ Values area and change its settings:

On the new screen that is shown just select Average:

Now we have the average grade for each term as we wanted. Look at the final result:

The value we get in Grand Total is congruous with the already calculated GPA we have inside the Grades sheet.

Pivot Chart
A pivot chart can be used to display a pivot table's summarized data through different charting types and any changes you make to the pivot table's summarized data will be reflected on the pivot chart.

To create a pivot chart you just have to follow the above steps we used to create a pivot table, but this time instead of selecting a PivotTable you must select PivotChart on the Insert tab.

Bellow is the pivot chart after being formatted:

Instead of Row Labels we have Axis Fields (Categories) inside the PivotTable Field List. I rearranged the pivot table report so that the terms are sorted accordingly. I also renamed the fields to reflect more precisely what the report data is about.

Summary
The possibilities for summarizing the data are innumerable and that's what makes a pivot table a so powerful resource.

A pivot chart is simply a chart that uses a pivot table to do data binding.

Get the sample spreadsheet at:

Microsoft Excel 2007 version - http://leniel.googlepages.com/PivotTableSpreadsheet.xlsx

Microsoft Excel 2003 version - http://leniel.googlepages.com/PivotTableSpreadsheet.xls

Breadth and depth first search - part 3

Breadth and depth first search - part 1
Breadth and depth first search - part 2

As an extra, today I'm posting the C++ code of the breadth and depth first search algorithms. Take a look at part 1 and part 2 of this series.

When I had to hand in the work for the artificial intelligence discipline, the teacher wanted the code in C++ and I had already started developing the code in C#. The result was two versions of the same functions. The good part is that I could master both languages while developing such a code.

The code presented here uses an adjacency matrix to represent the links between the cities that are part of the Romania map shown bellow.

The following is the adjacency matrix:

// Adjacency matrix
int map[21][21] = {
/*   A B C D E F G H I L M N O P R S T U V Z */
  {0,1,2,3,4,5,6,7,8,9,0,1,2,3,4,5,6,7,8,9,0},
  {1,0,0,0,0,0,0,0,0,0,0,0,0,0,0,0,1,1,0,0,1}, // Arad
  {2,0,0,0,0,0,1,1,0,0,0,0,0,0,1,0,0,0,1,0,0}, // Bucharest
  {3,0,0,0,1,0,0,0,0,0,0,0,0,0,1,1,0,0,0,0,0}, // Craiova
  {4,0,0,1,0,0,0,0,0,0,0,1,0,0,0,0,0,0,0,0,0}, // Dobreta
  {5,0,0,0,0,0,0,0,1,0,0,0,0,0,0,0,0,0,0,0,0}, // Eforie
  {6,0,1,0,0,0,0,0,0,0,0,0,0,0,0,0,1,0,0,0,0}, // Fagaras
  {7,0,1,0,0,0,0,0,0,0,0,0,0,0,0,0,0,0,0,0,0}, // Girgiu
  {8,0,0,0,0,1,0,0,0,0,0,0,0,0,0,0,0,0,1,0,0}, // Hirsova
  {9,0,0,0,0,0,0,0,0,0,0,0,1,0,0,0,0,0,0,1,0}, // Iasi
  {0,0,0,0,0,0,0,0,0,0,0,1,0,0,0,0,0,1,0,0,0}, // Lugoj
  {1,0,0,0,1,0,0,0,0,0,1,0,0,0,0,0,0,0,0,0,0}, // Mehadia
  {2,0,0,0,0,0,0,0,0,1,0,0,0,0,0,0,0,0,0,0,0}, // Neamt
  {3,0,0,0,0,0,0,0,0,0,0,0,0,0,0,0,1,0,0,0,1}, // Oradea
  {4,0,1,1,0,0,0,0,0,0,0,0,0,0,0,1,0,0,0,0,0}, // Pitesti
  {5,0,0,1,0,0,0,0,0,0,0,0,0,0,1,0,1,0,0,0,0}, // Rimnicu Vilcea
  {6,1,0,0,0,0,1,0,0,0,0,0,0,1,0,1,0,0,0,0,0}, // Sibiu
  {7,1,0,0,0,0,0,0,0,0,1,0,0,0,0,0,0,0,0,0,0}, // Timisoara
  {8,0,1,0,0,0,0,0,1,0,0,0,0,0,0,0,0,0,0,1,0}, // Urziceni
  {9,0,0,0,0,0,0,0,0,1,0,0,0,0,0,0,0,0,1,0,0}, // Vaslui
  {0,1,0,0,0,0,0,0,0,0,0,0,0,1,0,0,0,0,0,0,0}  // Zerind
};

Note that the first commented line represents the initial letter of each city's name. The mapping done with the adjacency matrix refers to these letters so that it's easier to understand. For example, getting the first entry of the adjacency matrix that refers to Arad: we have that Arad has paths that lead us to Sibiu, Timisoara and Zerind, thus we put a value of 1 on the columns that represent those cities, in this case, the columns beneath the letters S, T and Z. That's how the mapping is done. We put a value of 0 on the other columns to state that there is no path that leads us to those cities.

The code also has a hand made version of the stack and queue data structures. Each one of these structures is on its proper header file and are inline functions. See their implementations:

// Queue
struct Queue
{
  int start, end, tot;

  int info[max + 1];
};

void StartQueue(Queue *q)
{
  q->tot = 0;

  q->start = 1;

  q->end = 0;
}

int IsQueueEmpty(Queue *q)
{
  return q->tot == 0 ? 1 : 0;
}

int IsQueueFull(Queue *q)
{
  return q->tot == max ? 1 : 0;
}

int Adc(int x)
{
  return x == max ? 1 : x + 1;
}

void Enqueue(Queue *q, int x)
{
  if(!IsQueueFull(q))
  {
    q->end = Adc(q->end);

    q->info[q->end] = x;

    q->tot++;
  }
}

int Dequeue(Queue *q)
{
  int ret = 0;

  if(!IsQueueEmpty(q))
  {
    ret = q->info[q->start];
  
    q->start = Adc(q->start);
  
    q->tot--;
  }

  return ret;
}
// End Queue
// Stack
struct Stack
{
  int topo;

  int info[max + 1];
};

void StartStack(Stack *s)
{
  s->topo = 0;
}

int IsStackEmpty(Stack *s)
{
  return s->topo==0 ? 1 : 0;
}

int IsStackFull(Stack *s)
{
  return s->topo == max ? 1 : 0;
}

void Push(Stack *s, int x)
{
  if(!IsStackFull(s))
  {
    s->topo++;
  
    s->info[s->topo] = x;
  }
}

int Pop(Stack *s)
{
  int ret = 0;

  if(!IsStackEmpty(s))
  {
    ret = s->info[s->topo];
  
    s->topo--;
  }

  return ret;
}
// End Stack

The Breadth First Search and Depth First Search functions are written in the same fashion of the C# code, but with little modifications.

void BreadthFirstSearch(int origin, int destination)
{
  Queue *q = new Queue();

  StartQueue(q);

  Enqueue(q, origin);

  while(IsQueueEmpty(q) == 0)
  {
    int u = Dequeue(q);

    if(u == destination)
    {
      printf("Path found.");

      break;
    }
    else
    {
      visited[u] = 1;

      for(int v = 1; v <= 20; v++)
      {
        if(map[u][v] != 0)
        {
          if(visited[v] == 0)
          {
            visited[v] = 1;

            parents[v] = u;

            if(v != destination)
            {
              if(!IsQueueFull(q))
              {
                Enqueue(q, v);

                ShowPath(v);

                printf("\n");
              }
              else
              {
                printf("Queue full.");

                break;
              }
            }
            else
            {
              ShowPath(v);

              return;
            }
          }       
        }
      }
    }
  }
}
void DepthFirstSearch(int origin, int destination)
{
  Stack *s = new Stack();

  StartStack(s);

  Push(s, origin);

  while(IsStackEmpty(s) == 0)
  {
    int u = Pop(s);

    if(u == destination)
    {
      printf("Path found.");

      break;
    }
    else
    {
      visited[u] = 1;

      for(int v = 1; v <= 20; v++)
      {
        if(map[u][v] != 0)
        {
          if(visited[v] == 0)
          {
            visited[v] = 1;

            parents[v] = u;

            if(v != destination)
            {
              if(!IsStackFull(s))
              {
                Push(s, v);

                ShowPath(v);

                printf("\n");
              }
              else
              {
                printf("Stack full.");

                break;
              }
            }
            else
            {
              ShowPath(v);

              return;
            }
          }      
        }
      }
    }
  }
}

To show the travelled paths there is a recursive function called ShowPath:

void ShowPath(int u)
{
  if(parents[u] != 0)
    ShowPath(parents[u]);

  printf(" %s", cities[u]);
}

You see, I had finalized the C# code and even sent the code to the teacher, but I received his reply stating that he wanted the code in C++. I complained with him! I told him about the easiness that modern programming languages as C# offers us when writing code.

Today, the data structures (queue and stack) "hand made" in this code are present in modern and optimized fashions inside standard libraries. We just need to instantiate an object from that specific class, in this case, stack or queue, and tada, we get lots of functions that do the hard work. But the point here is not the easiness. What the teacher wanted to force us to do was to comprehend how those data structures really function.

Nothing is better than writing the data structures by yourself. Although I didn't agree at the time, I thank him for forcing me to learn. Needless to say, these are basic data structures and are used in a great amount of code. You'll see these data structures during your entire developer life.

Visual Studio C++ Console Application
You can get the Microsoft Visual Studio Project and the app executable at:

http://leniel.googlepages.com/BreadthDepthFirstSearchCPlusPlus.zip

Papers

The following list shows each paper I've already published online on this blog plus the post in which I comment about it. The list is chronologically organized.

List updated on 2/09/2009

  1. Fortran Numerical Constants Recognizer
    Reconhecedor de Constantes Númericas em Fortran
    http://www.leniel.net/2009/02/fortran-numerical-constants-recognizer.html
  2. A Syntactic Analyzer built with the CASE tools Flex and YACC
    Um Analisador Sintático Construído com as Ferramentas CASE Flex e YACC
    http://leniel.net/2008/04/syntactic-analyzer-built-with-lex-yacc.html
  3. Influence of Tonal and Spatial Resolution on the Image File Size
    Influência da Resolução Tonal e Espacial no Tamanho do Arquivo de Imagem
    http://leniel.net/2008/04/tonal-x-spatial-resolution-x-file-size.html
  4. Construction and Simulation of a Robot Arm with OpenGL
    Construção e Simulação de um Braço Robótico com OpenGL
    http://leniel.net/2008/02/robot-arm-with-opengl-in-csharp.html
  5. Development and Numerical Simulation of Algorithms to the Computational Resolution of Ordinary Differential Equations
    Desenvolvimento e Simulação Numérica de Algoritmos para Resolução Computacional de Equações Diferenciais Ordinárias
    http://leniel.net/2008/02/development-and-numerical-simulation-of.html
  6. Linguagem de Pesquisa Integrada à Linguagem de Programação
    http://leniel.net/2008/01/linq-language-integrated-query.html
  7. Top-Down Approach in Distributed Databases
    Abordagem Top-Down em Bancos de Dados Distribuídos
    http://leniel.net/2007/12/top-down-approach-in-distributed.html

New job at ITA-Petrobras

Last month was a busy one. On February 11th I started working on a project called Galileu. This project is being implemented by a joint venture between Petrobras and a group of universities. Amongst those universities is the Aeronautics Technological Institute (ITA).

I got such job opportunity through ITA's mechanical engineering department, more specifically the Computational Transport Phenomena Laboratory. I received an email from its group leader Marcelo de Lemos. I answered the email right way sending him my resume. They needed someone with expertise in programming languages and high performance computing (HPC). I was eagerly waiting a job opportunity because I finished the computer engineering course and there was no place to work. This opportunity was just what I needed.

My work is really exciting. Firstly I was given material about the message passing interface (MPI) and the Rocks clusters distribution for the Linux platform. After that I started playing with the Linux cluster, which was already installed. Who installed it was a great friend I met at the lab. His name is Arkady Petchenko.

As a lab we experiment with the available HPC platforms. The last two weeks I've been playing with the Windows Computer Cluster Server 2003. I was responsible for installing the Windows cluster.

I'm also doing development of code in C/C++ and Fortran. I compile and build applications that can explore the full potential of a cluster through the MPI API.

It's fantastic to see how a parallel program performs on different numbers of processors.

In future posts I'd like to discuss about the aspects of the technologies I work with. It's great stuff! I love programming languages and the parallel computing world is a fascinating one. With the increase of the number of processors in a single chip, we're going to see a vast amount of parallelized code being executed on distributed computing systems. Parallel APIs as the Microsoft Parallel Extensions for .NET framework are evolving rapidly. This will for sure change the way we think when working with code and specially with clusters and supercomputers.

Robot arm with OpenGL in CSharp

Robot arm
A robot arm or robotic arm can be classified as articulated and not articulated. It’s more autonomous than a simple mechanic arm and can be used to lift small parts with high precision and velocity. It’s generally used in tasks such as: welding, painting, assembling, packaging, storage, product inspection and test and even in spacecrafts as can be seen below:

OpenGL
OpenGL (Open Graphics Library) is a standard specification that defines an API (Application Program Interface) that is multi-language and multi-platform and that enables the codification of applications that output computerized graphics in 2D and 3D.

Computer graphics paper
I and a dear brother in faith of mine called Wellington Magalhães Leite wrote a paper titled: Construction and Simulation of a Robot Arm with OpenGL

We used the Tao Framework C# biding to OpenGL during the construction of the robot arm.

See one of the screenshots of our robot arm:

See the paper's abstract below:

The importance of projects related to the field of Computer Graphics in simulations has been growing a lot during the last years. Therefore it brings to life the necessity of mastering the concepts and techniques inherent to the process of elaboration, construction and simulation of a given graphical project.

The OpenGPL API specification tries to help us when we are programming the graphical details of a given project. In this article we’re showing the necessary steps and routines to the proper codification and simulation of a robotic arm in 3D, which is the most employed robot in the manufacturing industry and in areas that require a high precision rate.

With a simulation (virtual) model, we can have a closer vision of the object of study in contrast with reality, what make us capable of foreseeing how a determined object will look like and how it will behave after its proper construction in the physical world.

Keywords: robot arm, OpenGL, 3D simulation, computer graphics

You can get a PDF copy of the article at:

https://github.com/leniel/leniel.net/blob/master/Uploads/ConstructionSimulationRobotArmOpenGL.pdf

Visual Studio C# Windows Application
You can get the Microsoft Visual Studio Project and the executables at:

https://github.com/leniel/leniel.net/blob/master/Uploads/RobotArmOpenGLCSharp.zip

Development and Numerical Simulation of ODEs in C

Ordinary Differential Equation
In mathematics, an ordinary differential equation (or ODE) is a relation that contains functions of only one independent variable, and one or more of its derivatives with respect to that variable. To get in depth knowledge about ODEs refer to this article at Wikipedia.

A scientific magazine article
As the result of the Numerical Calculus discipline's classwork during the 4th term of the computer engineering course I and the teacher Dener Martins dos Santos decided to write an article about ordinary differential equations. In that discipline we studied about the classic methods for the resolution of ordinary differential equations.

We ended up with a concise informative article with the following title: Development and Numerical Simulation of Algorithms to Computational Resolution of Ordinary Differential Equations. Then we submitted the article to the scientific magazine of my alma mater university. We made it in the magazine called Revista Científica do Centro Universitário de Barra Mansa.

See the article's abstract below:

The computational simulation nowadays consists of a great tool assisting the learning process of complex mathematical calculations. This informative article shows how the computational resolution of differential equations assists in this learning. Two different types of computational resolution for differential equations are demonstrated: explicit Euler's method and Runge-Kutta's fourth order method. The programs were developed in C programming language. The results obtained via both methods are compared with the respective analytical solution (traditional, manual); in these a low level of generated computational error was perceived during their simulation, not compromising the methods.

Keywords: ordinary differential equations, numerical methods, C programming.

SUMMARY
1 INTRODUCTION
2 OBJECTIVE
3 REVISION
4 METHODOLOGY
  4.1 Programs
5 RESULTS
  5.1 Differential equation 1
      5.1.1 Initial conditions
      5.1.2 Analytical solution (traditional)
      5.1.3 Graphical solution
            5.1.3.1 Explicit Euler’s method
            5.1.3.2 Runge-Kutta’s fourth order method
  5.2 Differential equation 2
      5.2.1 Initial conditions
      5.2.2 Analytical solution (traditional)
      5.2.3 Graphical solution
            5.2.3.1 Explicit Euler’s method
            5.2.3.2 Runge-Kutta’s fourth order method
6 CONCLUSION
7 BIBLIOGRAPHY

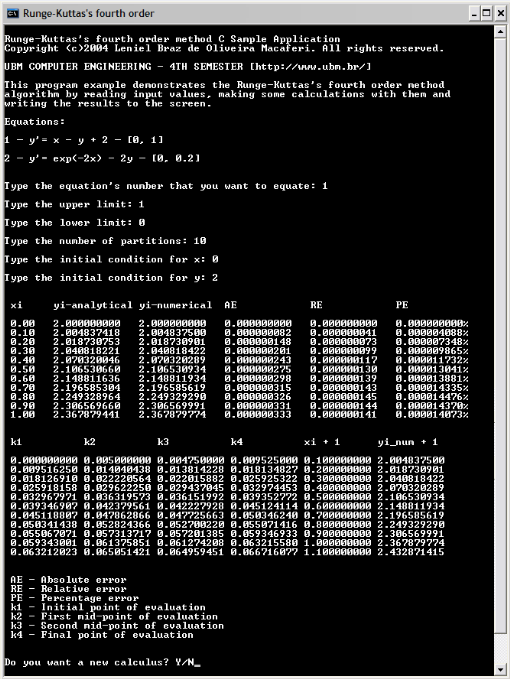
See a screenshot of the output of Runge-Kutta's fourth order method when simulated with the 1st equation described in the paper:

RungeKuttaFourthOrderMethod1stODE

You can get a PDF copy of the article at:

http://leniel.googlepages.com/DevNumSimOfAlgorithmsCompResOfODEs.pdf

Computer influence on society

It’s known that computers help men in the more diverse areas. We see nowadays that great part of men’s activities use in some way resources proceeding from the technological evolution that in its turn is leveraged by the advancement in computational resources. However, caution is necessary.

There are a lot of barriers that complicate men’s lives when they don’t use the computer power in an adequate way. Between those barriers I can cite: aspects related to health, social life, professional life and even education. Let’s see for example: if a man doesn’t take care of his physical body, it dies.

With the intensive use of computers, the majority of people forget about physical exercises. If a man forgets about the life outside, that is, thinks that the planet only spins around the computer, this man looses his life. If a man thinks that the computer can solve any problem, this man is wrong.

A computer is only a tool. The true architects are us, the men. Without our instructions the computer is incapable of executing a task.

Leaving the bad part of the topic, let’s see some positive effects of computers on society: information access through the internet that on the other hand lends to a better informed society. Increase in job opportunities coming from better environments. The velocity we arrive at results once unthinkable of being achieved. This velocity contributes to the development of advanced resources in the research area that on the other hand will influence the more diverse branches of society.

Computers are now part of our lives. It’s our responsibility to be rational and to search for better ways of interacting with them. We must evolve together with the technological innovations, but we must not give up life. We must not be bound to the new.

Only each one of us can choose its way but a world of information is here and whoever doesn’t try to get the perfect comprehension of reality can be in a worse position. You are your manager.